(this site is also available in Czech)
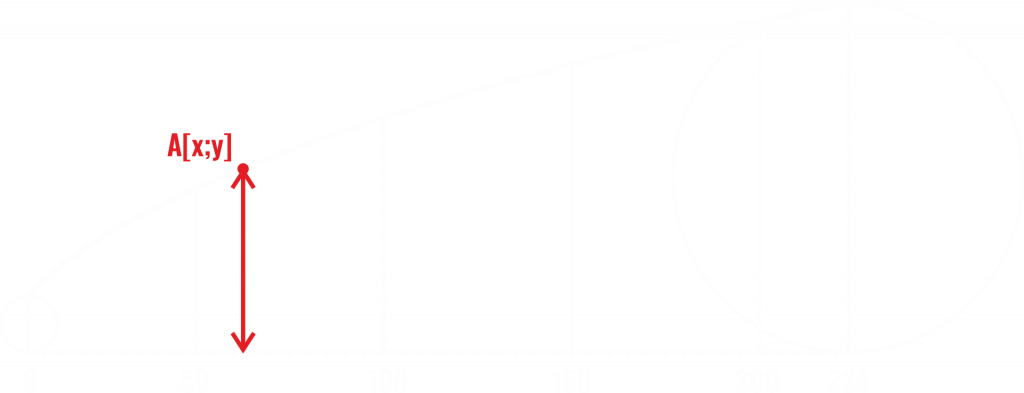
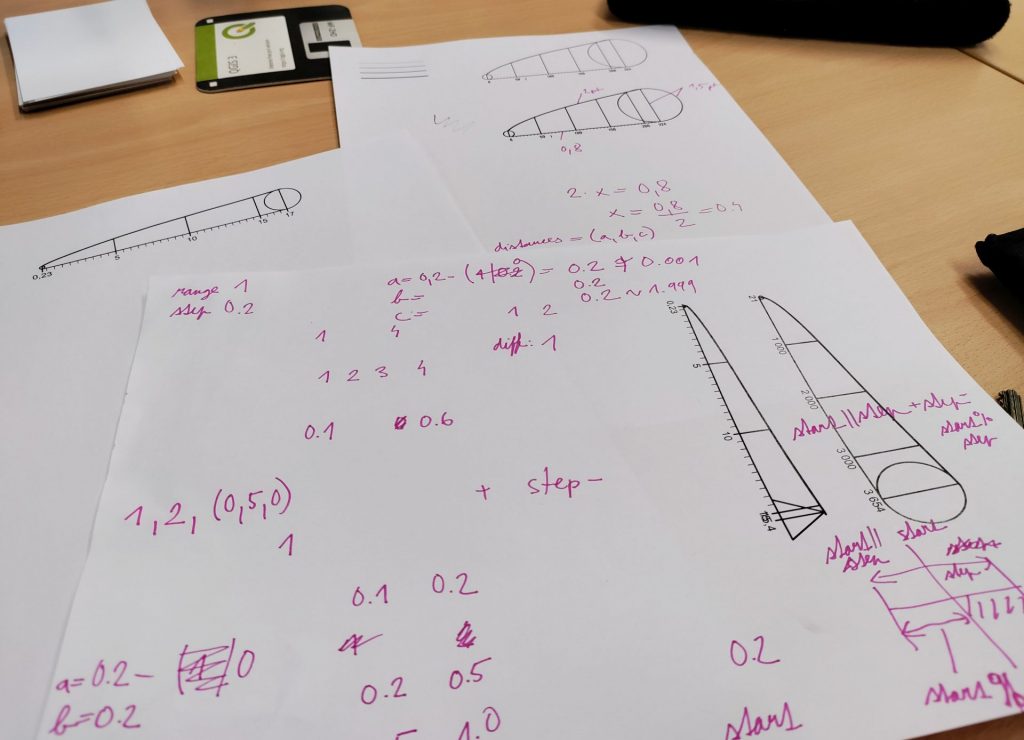
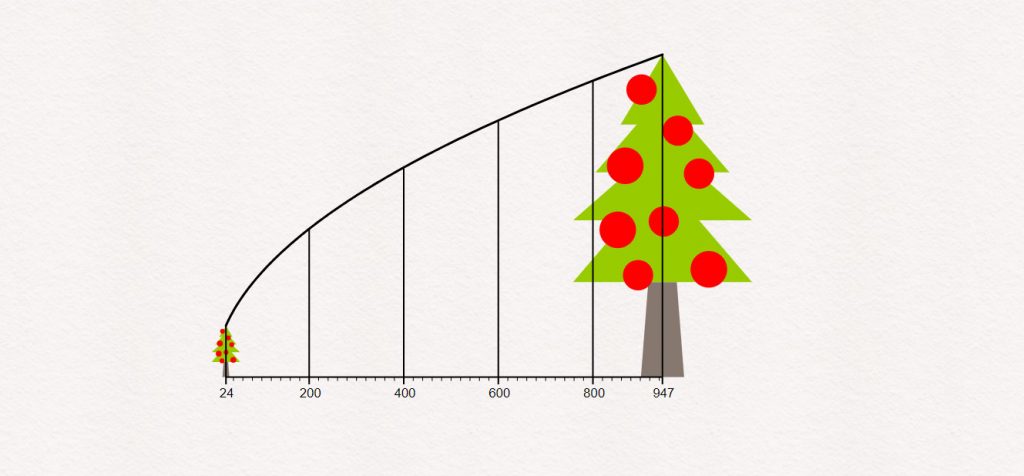
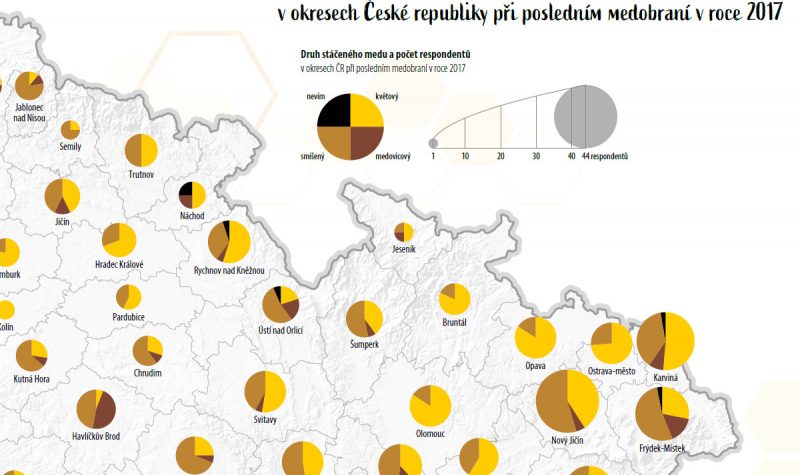
Designing an appropriate value scale for a proportional-symbol maps may be quite a challenging task for cartographers. Especially if we don’t talk about the most simple ones using bars, but rather plan to use shapes like a circle or square graduating their area accordingly to the phenomenon value. Unfortunately, none of the current GIS software provides us with the curve showing the relation between the symbol size and the mapped phenomenon value. As a result, we either settled for the automatically generated simplified legend, spent plenty of time calculating the curve for the specific data range and by its graphic design of the scale itself, or used unfair practices by drawing “some” approximating curve hoping nobody would recognise it.

But none of the solutions is sustainable. So the only way out of this struggle is to code some tool to help us with this issue. And so I decided to contact someone who is able to help me with this task and code it clearly and correctly. And this person was my dear friend Martin Holub studying computer science, who designed the tool’s architecture and key components of its functionality. I was explaining to him our cartographic secrets describing how the tool should work while he was the one saying to me “ok, I am here to end your suffering and repair the shit”. Not to be so modest, I also got involved in programming the web design of the presented platform, joined with coding some specific functionalities, and also helped with debugging some extreme cases. In short, it was a perfect interdisciplinary cooperation in which our university seems to have considerable reserves.

Anyway, the result is an online tool serving us cartographers independently of the GIS software used. After inputting the necessary parameters, it provides you with a value scale in vector form (SVG and PDF), which can directly be used in your map or easily adjusted in graphics software.

In late 2023, we came with first significant tool extension. New functionality have been added including automatic subdivisions design and possibility to import custom shapes of cartographic symbols in SVG format. This enhances the possibilities of use above the original regular shapes. Some algorithms were also optimised to provide more fluent operation.
REFERENCES
2023
Online value-scale generator for proportional symbol maps
BARVÍŘ, R., HOLUB, M. (2023). Abstracts of the ICA, 6(17), 1–2. DOI: 10.5194/ica-abs-6-17-2023


